Build Automated, Tailored Marketing Dashboards for Optimized Marketing Spend
End-to-end workflows with Posit Team
What You’ll Learn Today
Automating
Tailoring
The Cost of Manual Data Processing
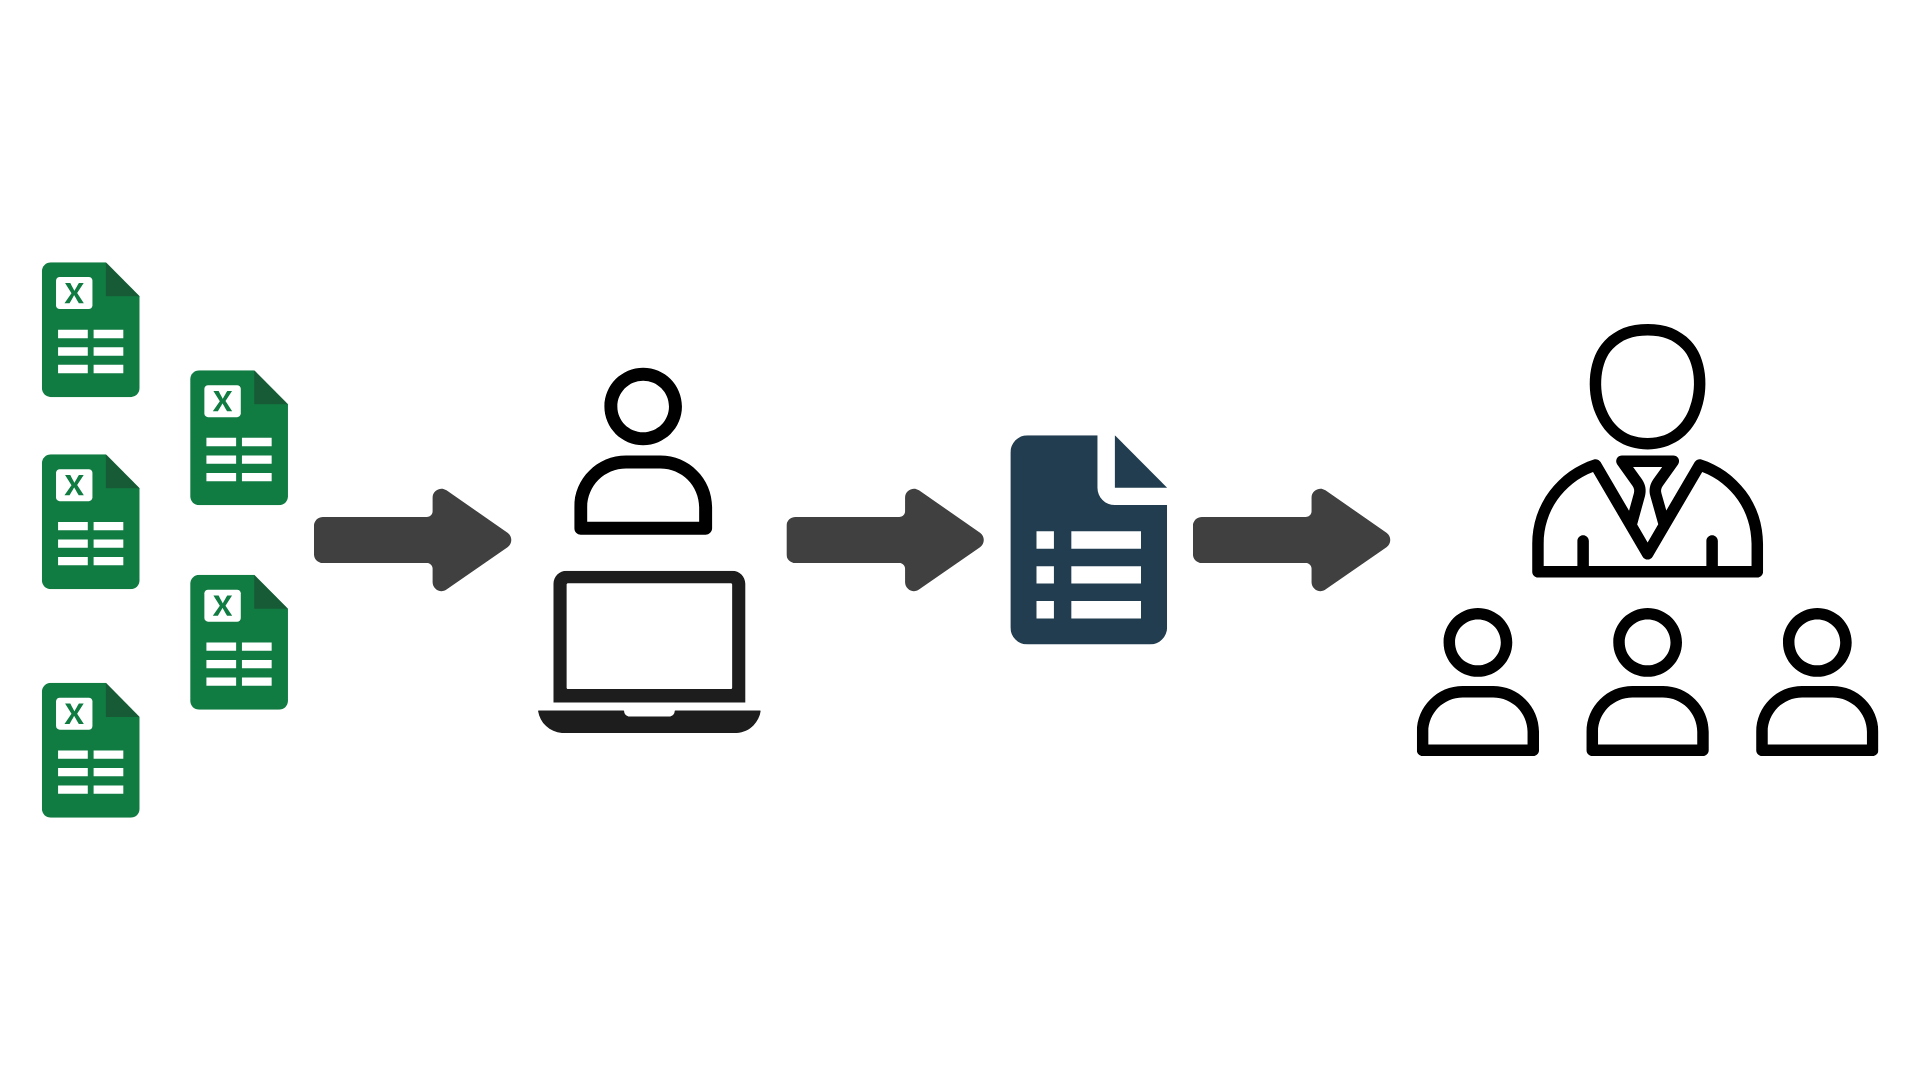
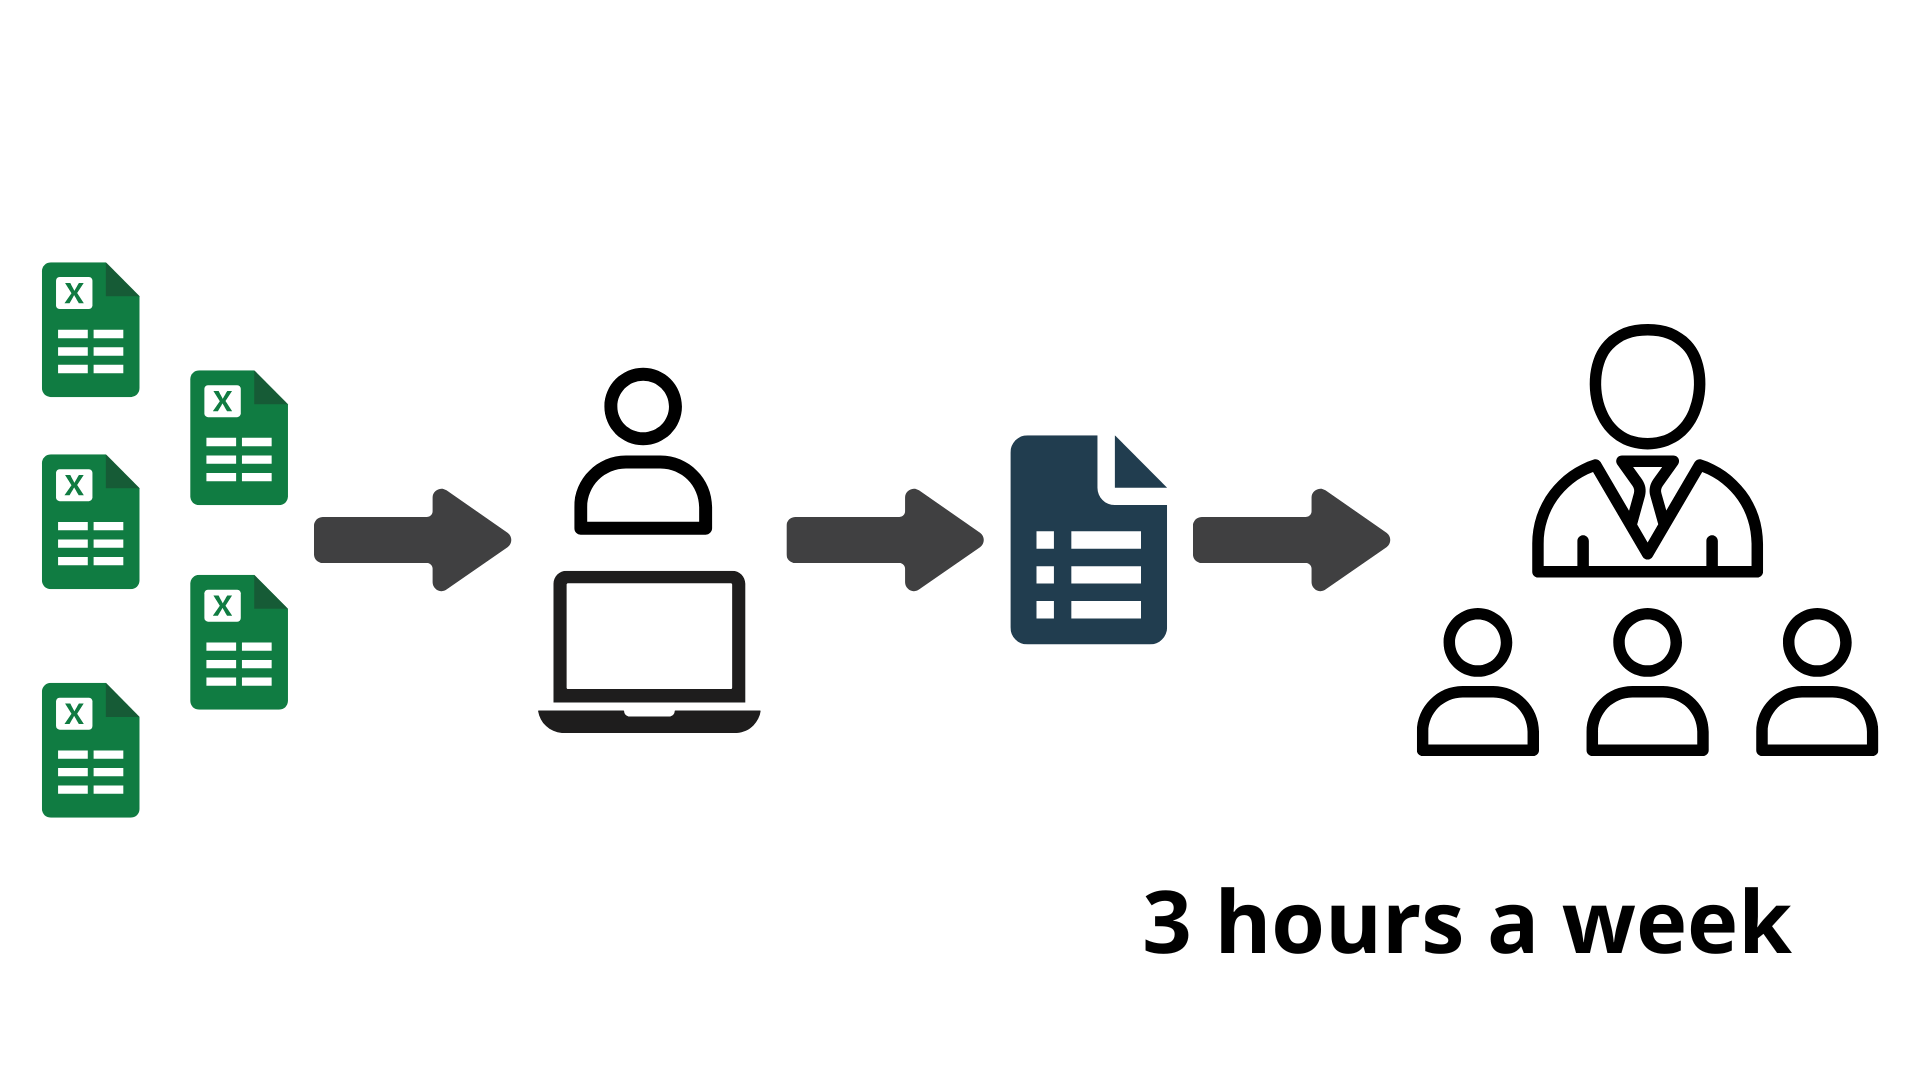
- Human error
- Single point of failure
- Leadership frustration
- Delayed and stale insights
Moving from Reactive to Proactive with Posit Tools
Laying the Foundation
Posit Tools
Automating
Tailoring
Foundational Elements for Success
Posit Tools
Automating
Tailoring
Knowing Your Audience
- What they want: Key metrics, specific insights.
- How they want it: Format, level of detail.
- How often they want it: Frequency of updates.
- Why they want it: The decisions they need to make.
Knowing Your Data
- What data you have: Sources, access, security.
- How often your data is updated: Refresh cycles.
- When does your data change: Volatility and consistency.
- What issues your data has: Gaps, inconsistencies, biases.
- How your data ties to the audience’s questions: Relevance and actionability.
Knowing Your Resources
- What tools/resources do you have at your disposal?
- What is your timeframe for getting something delivered?
- Are you working with other analysts and do you need to collaborate?
- How can you get feedback and incorporate it into your solution?
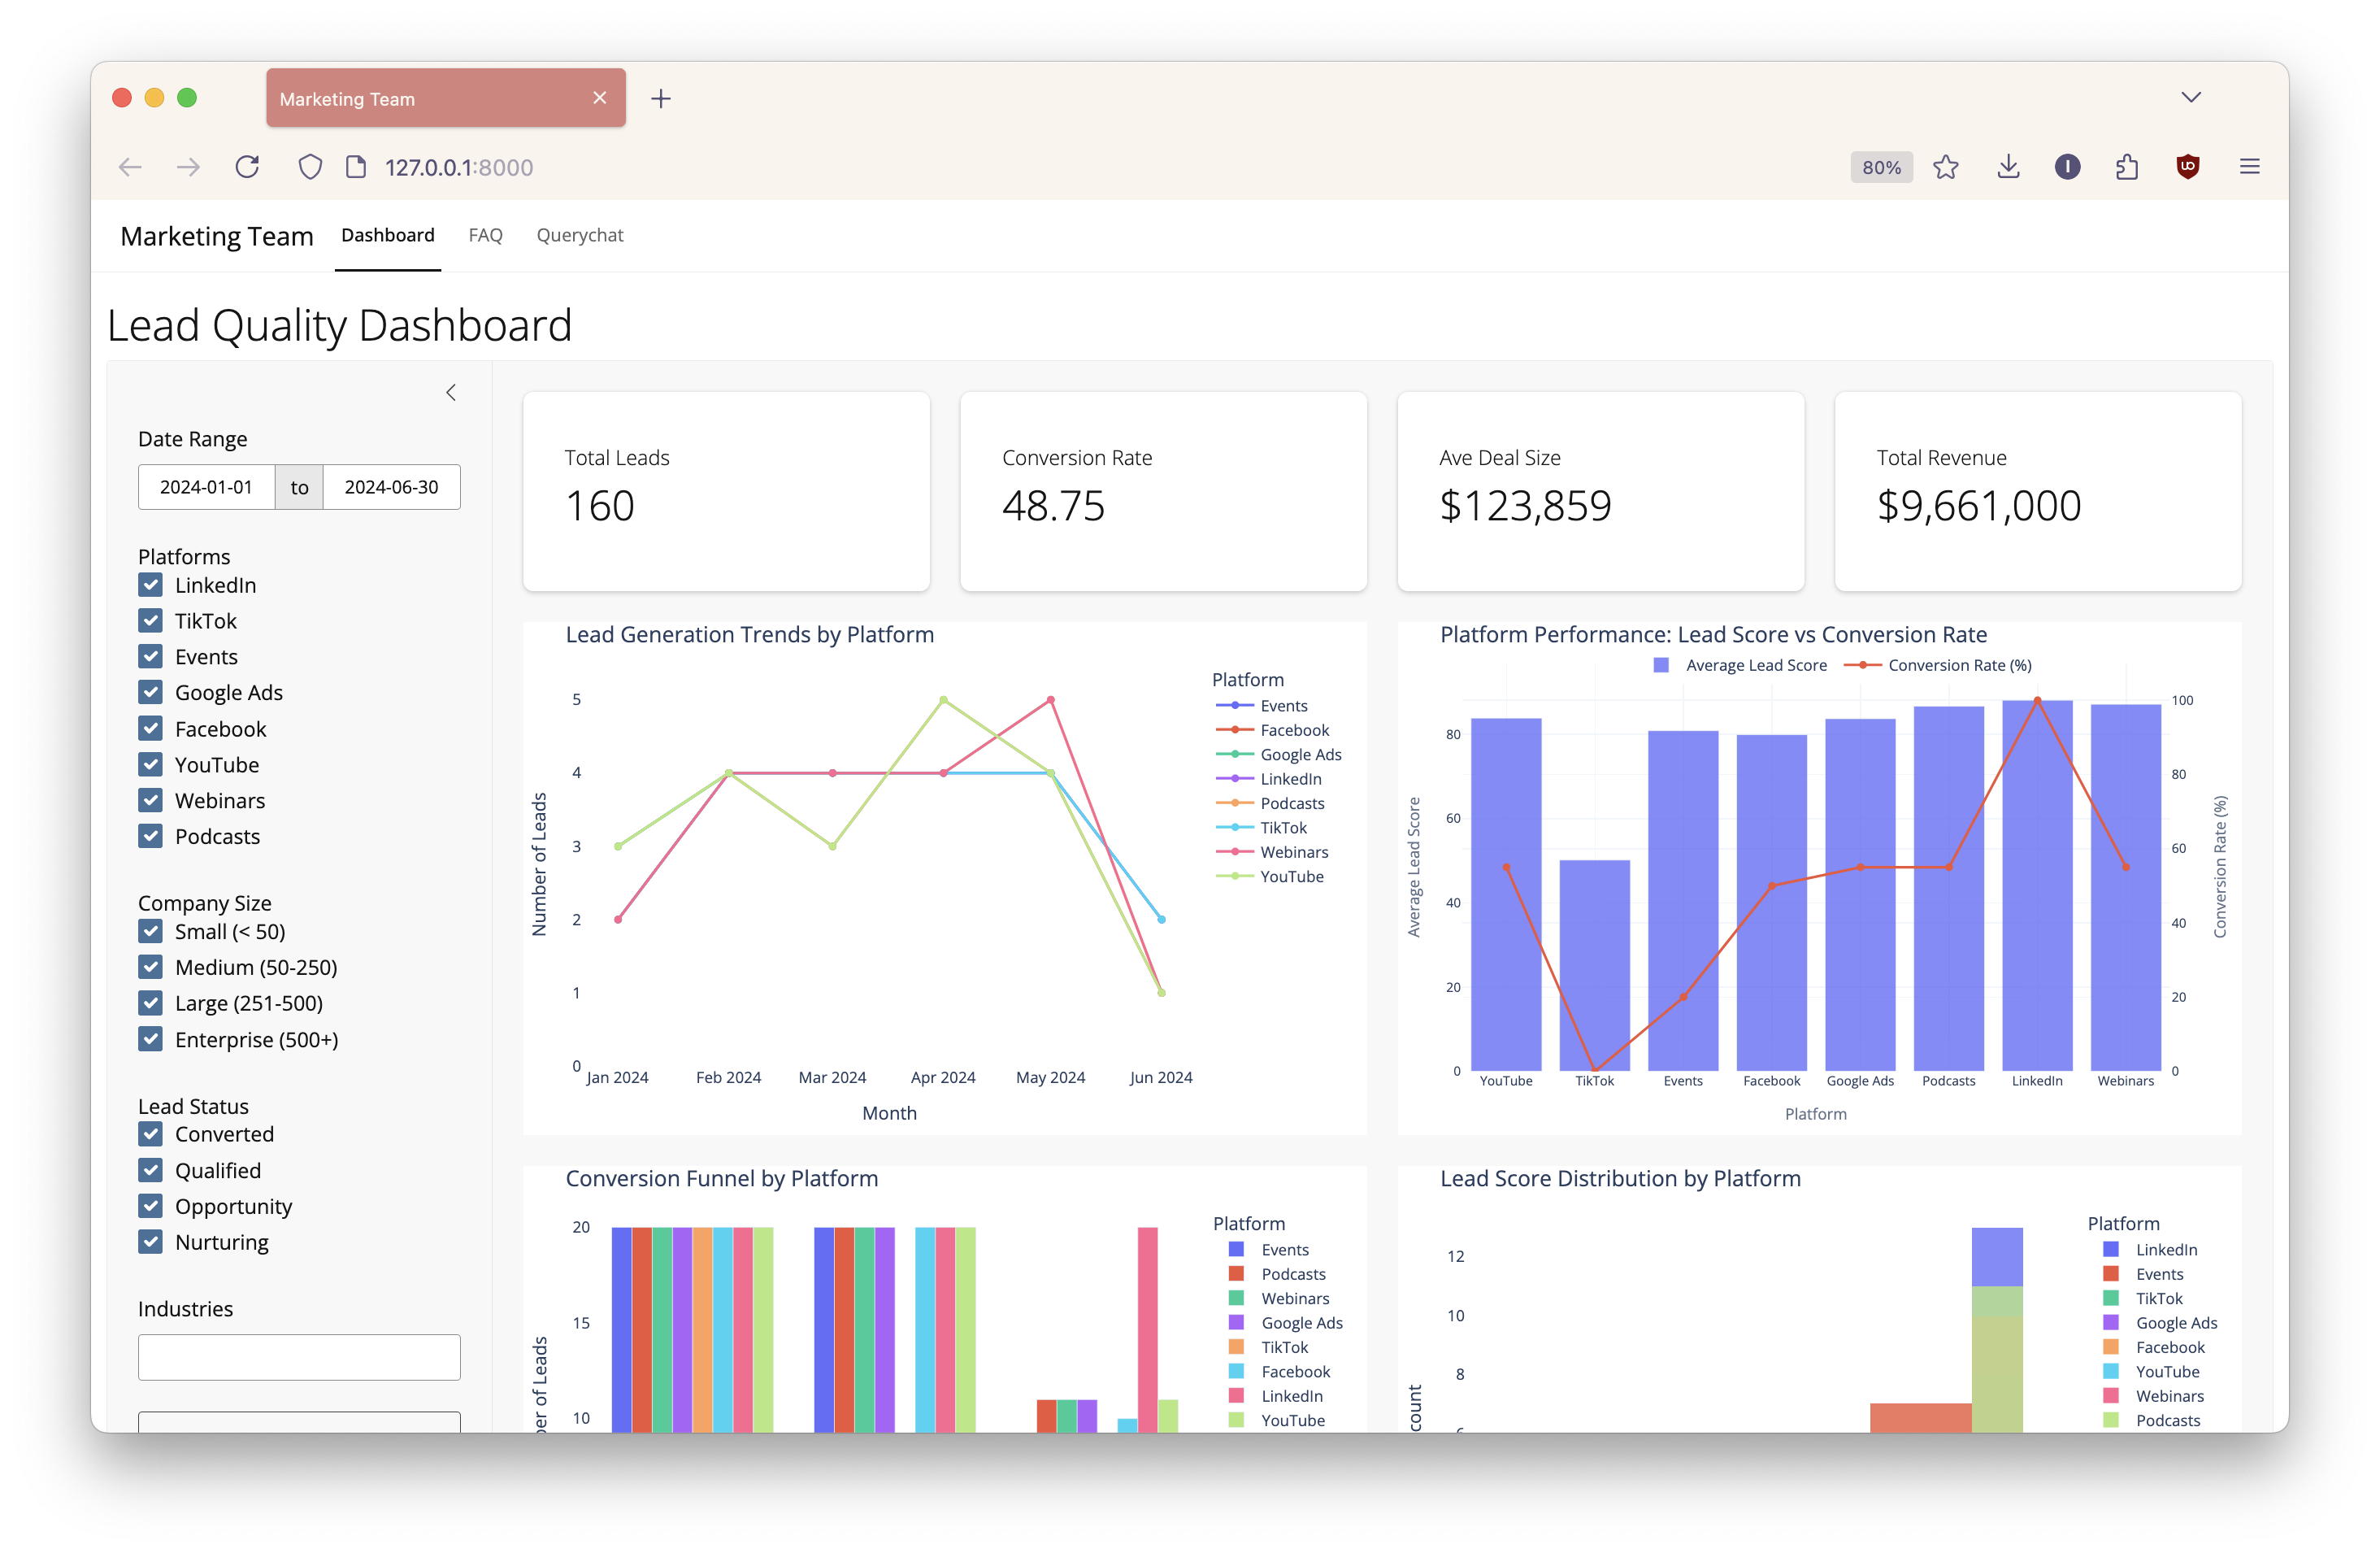
Marketing Scenario
Key Marketing Terms
- Leads: A potential customer or someone who has shown interest in a product or service.
- Lead score: A rating based on how likely a lead is to become a paying customer.
- Conversion: When a lead (or anyone) takes a desired action that moves them further down the path to becoming a customer.
- Opportunity rate: A metric that measures how well we convert qualified potential deals into paying customers.
Today’s Audience: Terry, Chief Marketing Officer
Needs: Concise summaries, trend analysis, top-line KPIs, strategic insights.
Delivery: Daily email alerts (for critical shifts), weekly executive summary.
Key Questions:
- Where is our marketing spend having the most impact in terms of leads and revenue generated?
- What’s our cost per lead across different channels?
- Are we meeting our quarterly/annual lead generation and pipeline contribution goals?
Today’s Audience: Taylor, Sr. Campaign Marketing Manager
Needs: Drill-down visualizations, campaign-specific performance, comparative analysis, content effectiveness.
Delivery: Weekly (for campaign optimization), ad-hoc (for deep dives).
Key Questions:
- How many leads did our LinkedIn campaign generate last month, and what was its conversion rate?
- Are there specific stages in the lead journey where my campaigns could be more effective?
- Should we reallocate budget from social media campaign A to event campaign B based on recent lead quality?
Today’s Audience: Alex, VP of Sales
Needs: Focus on sales-ready leads, conversion rates to opportunities, sales pipeline value from marketing sources.
Delivery: Daily (for lead assignments/prioritization), weekly (for sales forecasting), ad-hoc (for specific channel reviews).
Key Questions:
- What’s the average lead score of leads passed to us?
- Which marketing channels are producing the highest quality leads that convert into opportunities?
- Which industries are leading to the highest conversion?
Today’s Data Sources
- Salesforce lead data containing names, company, company size, etc., stored in a Snowflake database.
- Lead quality metrics, stored in an API
- LinkedIn/TikTok/Facebook/YouTube and other platform performance data, accessible via individual CSVs.
Today’s Resources
- Posit Team (Workbench, Connect), Anthropic Claude 4 Sonnet, open-source packages
- Time is up!
- Working alone
- Getting feedback through conversations and the Connect API
Posit Automation Workflow for Lead Performance Reporting
Step 1: Connecting Your Data Silos
Challenge: Data scattered across Salesforce (CRM), social media platform APIs, and event registration systems.
Solution: Leverage open-source packages and Posit Workbench’s secure credential management for direct data connections.
Step 2: From Raw Data to Actionable Data
Challenge: Transforming raw, often messy, and disparate data into a clean, structured, and actionable format suitable for a dashboard.
Solution: Automate a Quarto document for the Extract-Transform-Load (ETL) process on Posit Connect. Use pointblank + Workflow Execution Monitoring to ensure smooth operations.
Step 3: Building the Tailored Dashboard with Shiny
Challenge: Designing and implementing an interactive dashboard that effectively meets the diverse and often conflicting needs of various stakeholders, while simultaneously reducing data overload and clarifying complex insights.
Solution: Shiny empowers you to create dynamic and user-centric dashboards!
Shiny Enables…
- Drill-downs: Allowing leadership to explore specific campaigns, lead sources, or timeframes.
- Dynamic Data Visualizations: Charts and graphs that respond to user selections.
- Flexible User Interfaces: Designing intuitive layouts that simplify complex information.
- LLM Integration: Adding powerful AI-driven analytics capabilities.
Step 4: Automated Scheduling & Secure Delivery
Challenge: Ensuring consistent, timely, and secure delivery of automated reports and dashboards to the relevant stakeholders.
Solution: Configure Posit Connect to send direct links to the interactive Shiny dashboard (or HTML reports from Quarto) on a schedule. For example, deliver to the Marketing Leadership team every Monday morning at 8:00 AM, two hours before their meeting, and send tailored emails to each individual stakeholder.
Step 5: Continuous Improvement
Challenge: Ensuring the long-term relevance, effectiveness, and adaptability of the automated data product by establishing robust mechanisms for ongoing refinement and safely extending data access to advanced users.
Solution: Access usage data via the Posit Connect API to identify possible issues or bottlenecks. This data-driven feedback loop allows for continuous optimization of your dashboards and workflows.
Happy Leadership, Happy Analyst
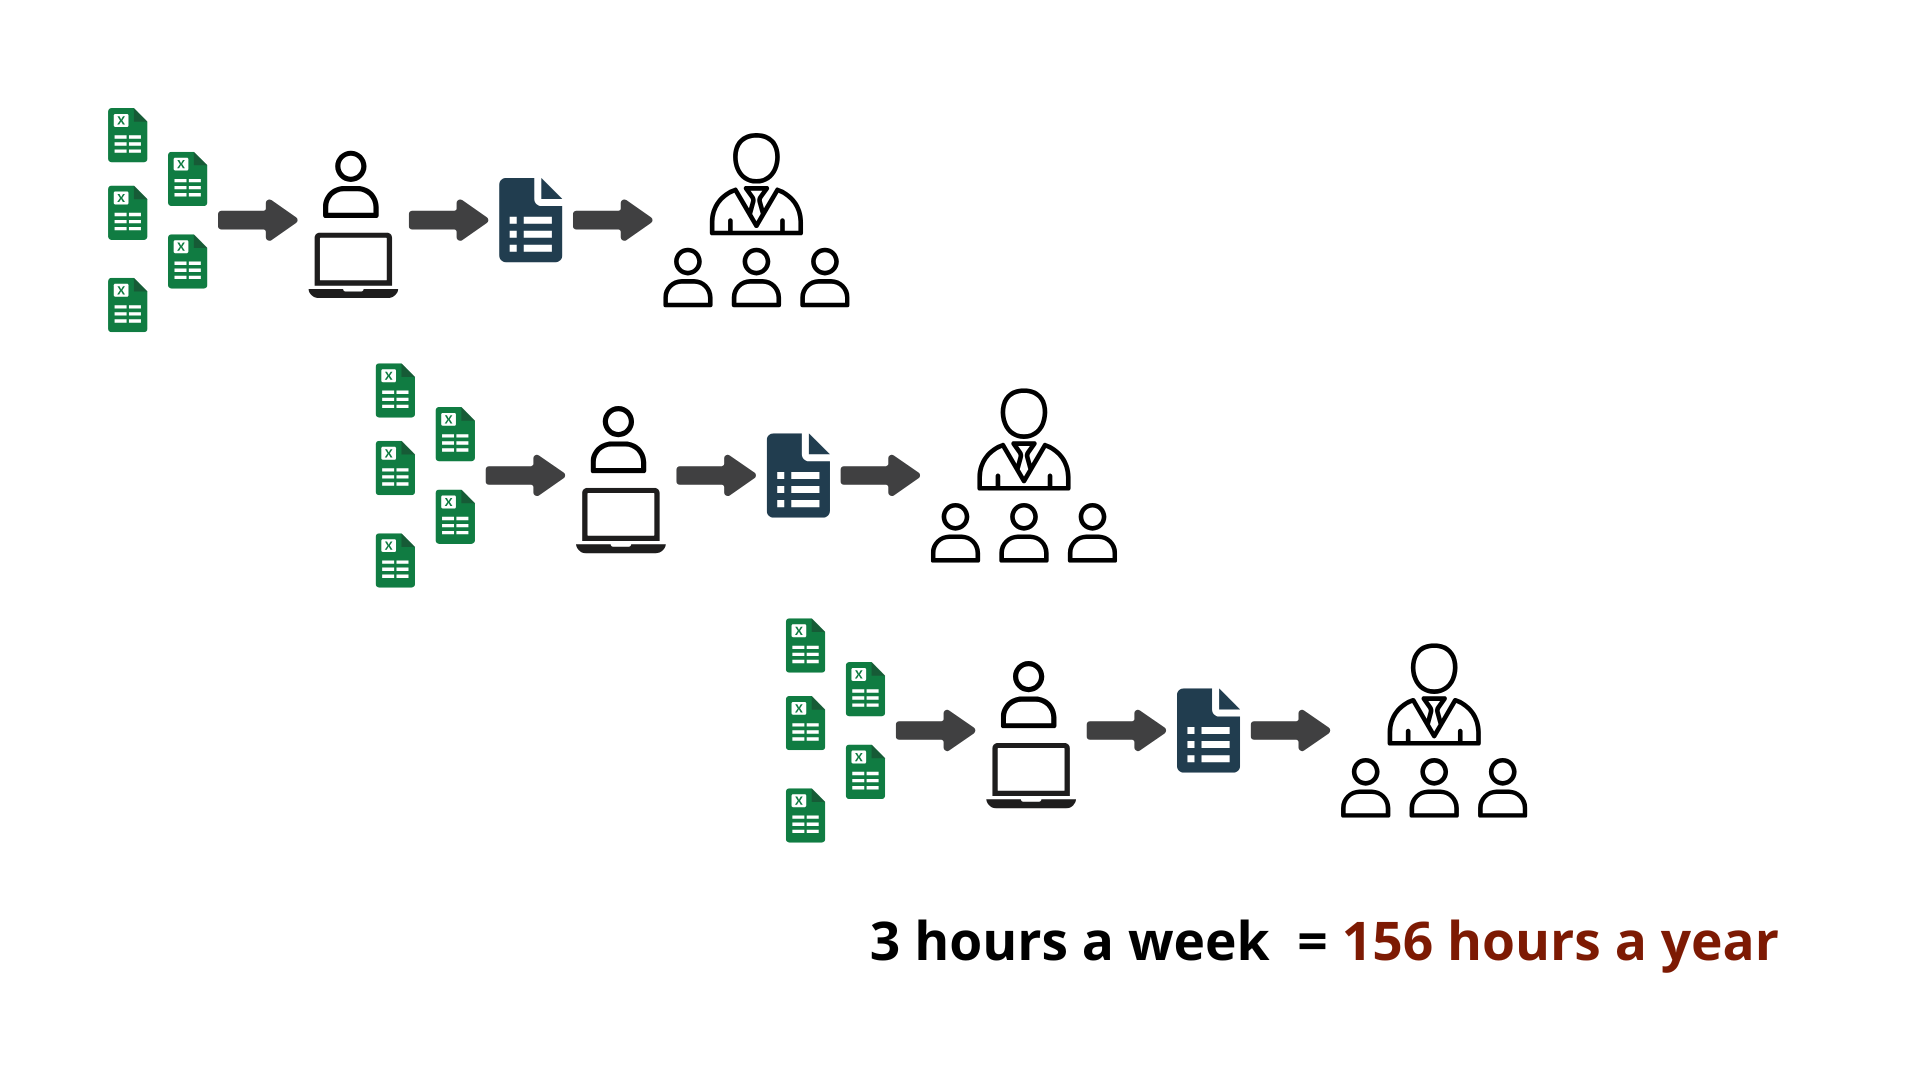
Picture a New Scenario
- Isabella can reclaim 3 hours/week, totaling over 100 hours/year.
- Data-Driven Confidence, to make truly informed budget allocation decisions.
- Leverage the latest tools, including AI, to stay ahead in marketing intelligence.
- Transition from a fragile, manual process to a robust, automated, and scalable solution.
![]()